Patents are big business for individuals, corporations, and even governments. According to USPTO sources, 325,979 patents were granted in 2015. The following article delves into more details on 2015 patent statistics in charts and graphs.
Table of Contents:
1. Patent Types
6. Corporations Granted the Most Patents in 2015
1. Patent Types
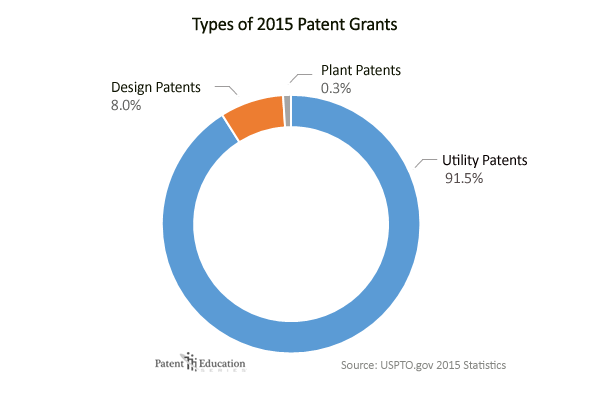
There are 3 main types of patents; utility, design, and plant patents. Utility patents are issued for new and useful processes, machines, manufactures, and compositions of matter. Design patents are those that incorporate a new, original, and ornamental design embodied into an article of manufacture. Plant patents are issued for new and distinct plant varieties. The plants must be asexually reproduced and can either be invented or discovered.
Of the three patent types, utility patents are the most common. They accounted for over 91% of all patent types granted in 2015.
2. Utility Patents
Examples of utility patents include rocket engines, new drugs, and even textiles. We’ll take a quick look at 2015 utility patent statistics in this section.
2.1: U.S. vs Foreign Origination
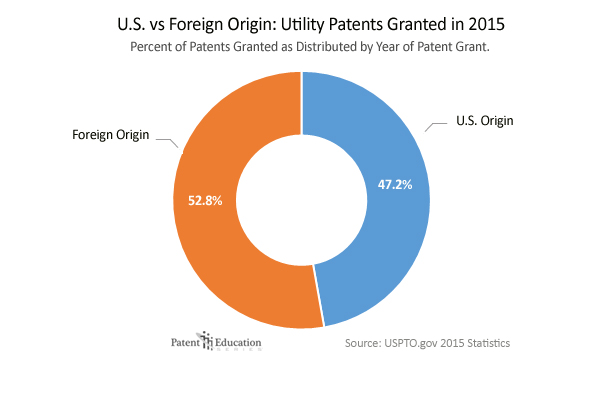
Slightly more than half of all utility patents granted by the USPTO in 2015 originated in foreign countries as opposed to the U.S. There were a total of 298,407 utility patents granted by the USPTO in 2015.
2.2: Top Patent Producing Countries
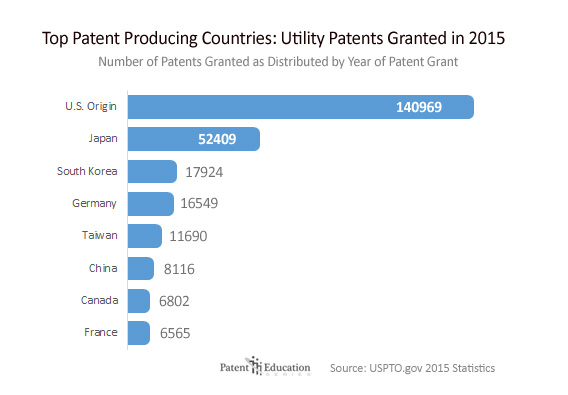
Over 140,000 utility patents were granted in the U.S. in 2015. Japan was second to the U.S. with over 50,000 utility patents received in 2015. South Korea, Germany and Taiwan each also received over 10,000 utility patents in 2015.
2.3: Entity Breakdown
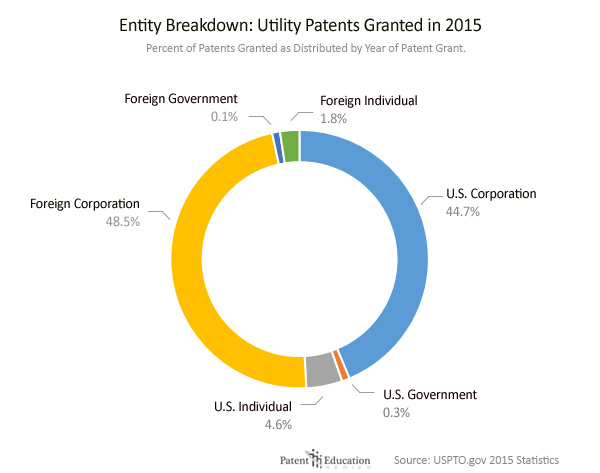
Most patents were granted to corporations as opposed to the government or individuals whether foreign or U.S. based. Nearly 10 times as many patents were granted to corporations compared to individuals and 100 times as many patents were granted to corporations compared to governments. This holds true for both foreign and U.S. based utility patents.
3. Design Patents
An example of design patents include a new design for a headboard. This section looks at design patent statistics for 2015.
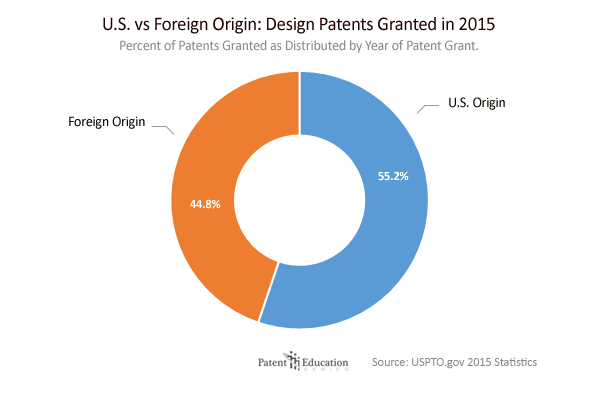
3.1: U.S. vs Foreign Origination
More than 55% of design patents granted by the USPTO in 2015 were of U.S. origin. There were a total of 25,986 design patents granted by the USPTO in 2015.
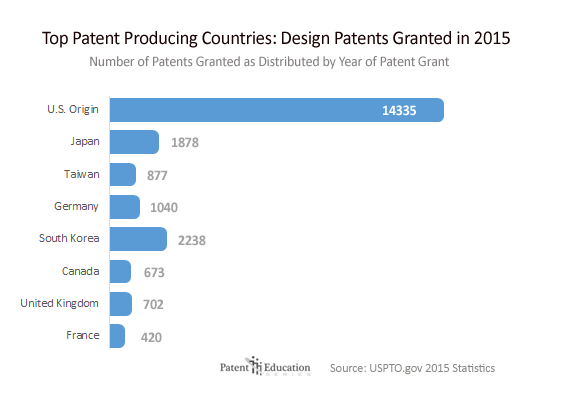
3.2: Top Patent Producing Countries
The U.S. was granted over 14,000 design patents in 2015. South Korea, Japan, and Germany were each granted over 1,000 design patents that same year.
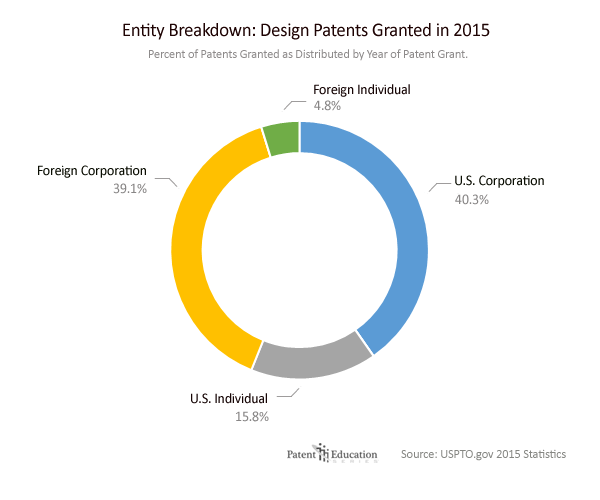
3.3: Entity Breakdown
Design patents originating in the U.S. were granted to corporations (40.3%) and individuals (15.8%). Design patents were granted to foreign corporations (39.1%) and foreign individuals (4.8%). Governments were not granted design patents in 2015.
4. Plant Patents
Plant patents may be obtained for new and distinct varieties of plants including vegetables and ornamental varieties. This section covers statistics on plant patents in 2015.
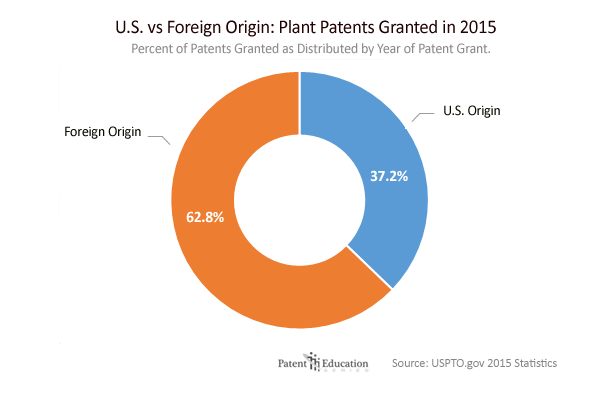
4.1: U.S. vs Foreign Origination
Fewer plant patents originated in the U.S. (37.2%) than those of foreign origin (62.8%) in 2015.
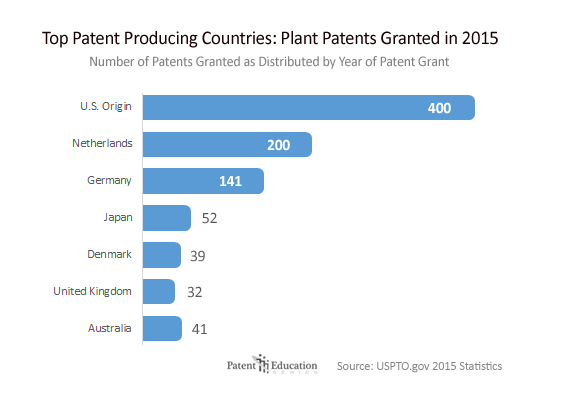
4.2: Top Patent Producing Countries
Four hundred plant patents of U.S. origin were granted in 2015. The Netherlands and Germany were each granted over 100 plant patents in 2015.
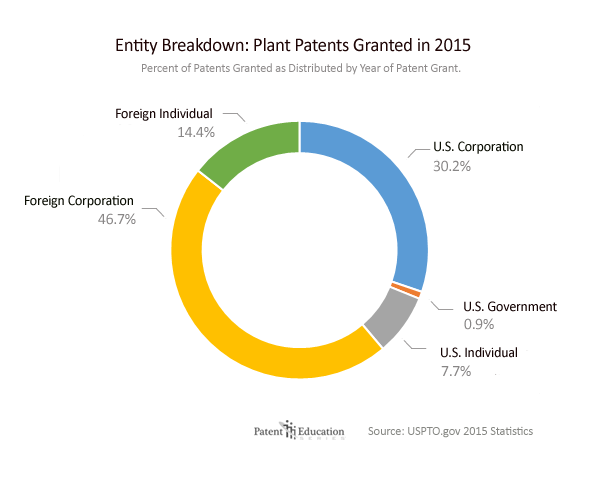
4.3: Entity Breakdown
The majority of plant patents in 2015 were granted to foreign corporations (46.7%). U.S. corporations trailed behind (30.2%) while foreign individuals (14.4%) and U.S. individuals (7.7%) were both granted plant patents at a much higher rate than the U.S. government (0.9%).
5. Patents By State
California was granted the most patents in 2015. Over 43,000 patents were granted in California in 2015. In the same year, over 10,000 patents were granted in Texas. Over 5,000 patents were granted in each of the following states; New York, Illinois, Michigan, New Jersey, and Washington in 2015.
All Patent Types Granted by State in 2015
Number of Patents Granted as Distributed by Year of Patent Grant.
Light blue indicate less than 1,000 patents were granted in that state. Dark blue indicates over 1,000 patents were granted in that state.
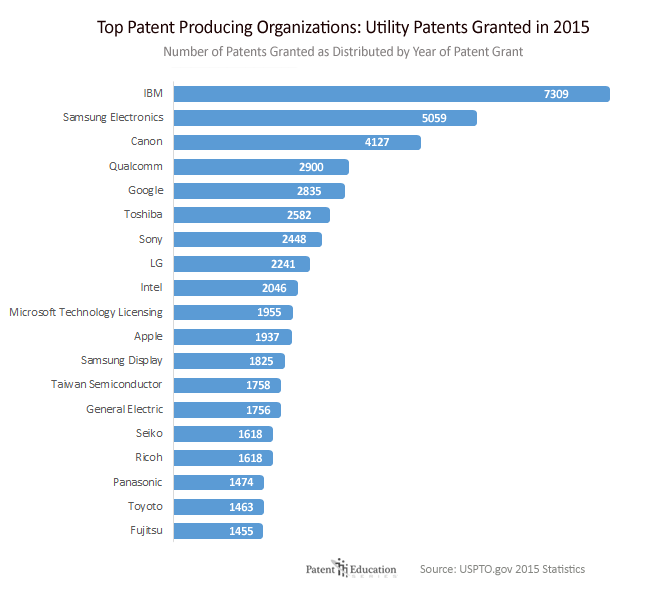
6. Corporations Granted the Most Patents in 2015
IBM lead the way with the most patents granted in 2015. Inventors at IBM received 7,309 patent grants which, according to the IBM website, is a record for them and the 23rd consecutive year they have been the top patent producing company. Samsung Electronics followed with over 5,000 patent grants. Canon, Qualcomm, Google, Toshiba, Sony, LG, and Intel were each granted over 2,000 patents in 2015.
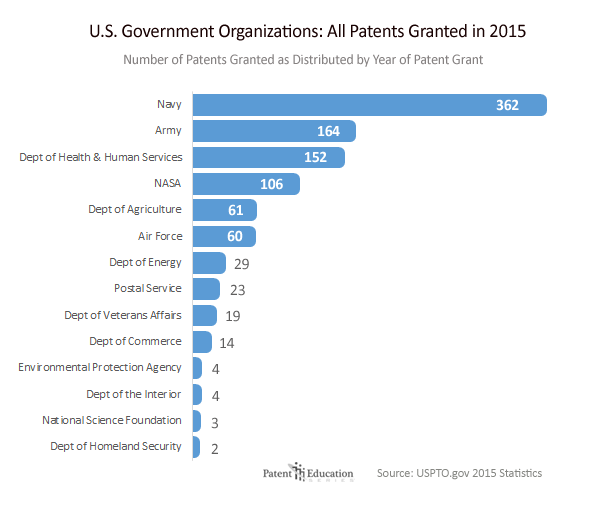
7. U.S. Government Patents
Only 0.3% of all utility patents were granted to U.S. government agencies in 2015. Of the patents granted to the U.S. government, the U.S. Navy lead the way with 362 patents granted. The Army, Department of Health & Human Services, and NASA were each granted over 100 patents in 2015. Based on the statistics, the U.S. government invests more in military based patents than any other government agency by far.
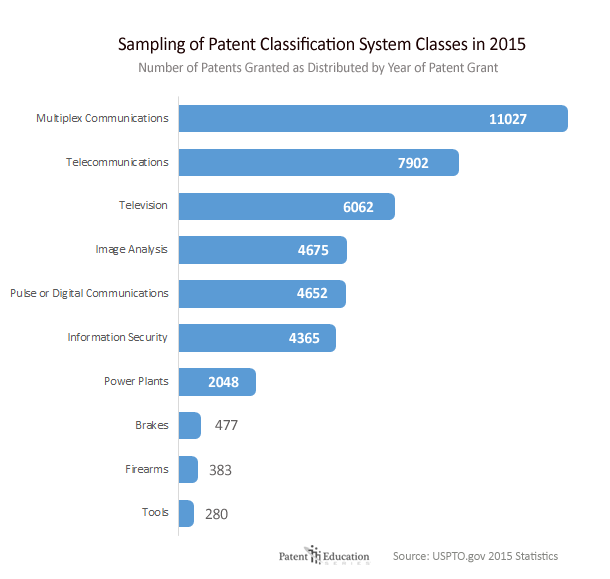
8. Patent Technologies
The chart below displays a few patent classes along with the number of patents granted for each in 2015. For example, over 11,000 patents were granted in the area of multiplex communications and nearly 8,000 patents were granted in the area of telecommunications. Contrast that with the 280 patents granted in 2015 that were classified as tools.
This chart counts all patent documents including utility, design, plant, and reissue patents as well as statutory invention registrations and defensive publications.
Wrap-Up
As shown in the graphs and charts above, all data was collected by the USPTO.gov and is based on 2015 statistics. Feel free to re-publish any of the graphs and charts. If you use them, please link back to PatentEducationSeries.com so your readers can see all the data we have compiled here.